
Responsible Operations
Reducing our Company-wide Environmental Footprint
With goals to reduce environmental impacts across our value chain, we invest in innovative solutions that can conserve natural resources and lower the energy intensity of our operations. A few examples of our most recent successes include:
- Water recycling project, which uses Reverse Osmosis reject water for secondary use. This project was implemented in mid-2016 and has recycled more than 265,000 gallons (1.003 million liters) of reject water, which would have otherwise been discharged to the sewer.
- Energy-efficient technologies such as Emulsion Aggregation (EA) toner, which is estimated to generate 28 percent fewer greenhouse gas (GHG) emissions in the manufacturing process than conventional toner.
- Energy management and equipment upgrades such as utilizing outdoor heat exchange systems to cool process water in winter months (rather than powered industrial chillers) and replacing outdated heating and cooling systems with energy-efficient and digitally-controlled models.
- Renewable energy used to power our Netherlands facilities and renewable energy certificates to offset energy use at our Wilsonville, Oregon facility.
- Efficiency-promoting initiatives including purchasing energy-efficient lighting and vehicles, reducing packaging sizes, mileage tracking and route improvements.

Learn more about the data presented in this section. +
Data in this section associated with air emissions, releases, water use, hazardous and non-hazardous waste represents total quantities for our manufacturing, research, development, warehouses and equipment recovery/recycle operations. Data in this section associated with energy and greenhouse gas (GHG) emissions represent total quantities for our manufacturing, research, development and equipment recovery/recycle operations, offices and data centers. Normalized values for 2014 forward have been calculated using Xerox revenue from continuing operations. Unless otherwise noted, all numbers represent worldwide totals (excluding Global Imaging Systems (GIS) locations) and are reported in generally accepted international units.
The data presented is based on actual measurements to the extent possible. Where direct measurements are not available, we employ engineering calculations or estimates. We continue to strive to increase the accuracy of the data we report.
All of our major manufacturing and distribution operations employ an environmental management system that conforms to ISO 14001. The system:
- Establishes a framework to ensure compliance with regulations and Xerox standards
- Identifies environmental impacts and sets objectives and performance targets
- Pursues continual improvement in conserving natural resources, eliminating the use of toxic and hazardous materials, preventing pollution, and recovering, reusing and recycling materials
- Ensures integration between day-to-day business activities and environmental planning and program management
- Encourages innovative solutions, creative partnerships and employee involvement
Our major manufacturing operations have been certified to ISO 14001 since 1997. Our major worldwide technology equipment distribution centers achieved certification in 2010. Quarterly status meetings and use of a newly deployed scorecard provide visibility, best practice sharing and innovation across our operations.
Energy Goal 2020
In 2003, we made a public commitment to reduce GHG emissions — our carbon footprint — by joining the U.S. Environmental Protection Agency (EPA) Climate Leaders program and launching our own internal Energy Challenge 2012.
This 10-year initiative set a goal to reduce GHG emissions across all company operations by 10 percent by 2012. We met this target six years ahead of schedule, so we set a new target of 25 percent reduction by 2012 (from a 2002 baseline). At the conclusion of the program, we successfully cut emissions by 42 percent — that’s 210,000 tons of carbon dioxide equivalents (CO2e) — and reduced energy consumption by 31 percent.
Our new corporate-wide goal is to reduce energy consumption and GHG emissions by 20 percent by 2020 (from a 2012 baseline). In 2016, we met our new goal by reducing energy consumption by 20 percent and cut GHG emissions by 28 percent — that’s 92,000 tons of CO2e.*
*Excludes data centers numbers. Energy Challenge 2012 included fleet and facilities for the Technology Business (and Services where co-located). Energy Goal 2020 encompasses all parts of our business.
Energy Consumption

Energy and GHG emissions totals are associated with fuel consumption by company-owned fleet and natural gas/electricity consumption in facilities. Vendor invoices from utility and fuel providers are the preferred source of data; when unavailable, estimates have been used.
In accordance with the Greenhouse Gas Protocol and to make annual data comparable, we adjust the energy and emissions data each year as a result of the opening and closing of facilities and more appropriate emission factors that are available.
Greenhouse Gas Inventory
In accordance with the international guidelines of the Greenhouse Gas Protocol developed by the World Resources Institute and the World Business Council for Sustainable Development, we track the six major GHGs: carbon dioxide (CO2), methane (CH4), nitrous oxide (N2O), hydrofluorocarbons (HFCs), perfluorocarbons (PFCs) and sulfur hexafluoride (SF6). As noted, we express our carbon footprint in terms of carbon dioxide equivalents (CO2e).
Energy sources account for more than 99 percent of our GHG emissions. Our GHG inventory includes direct emissions from the combustion of fossil fuels, primarily natural gas, and indirect emissions from purchased electricity and steam at our manufacturing sites, offices and warehouses. The inventory also includes the combustion of gasoline and diesel fuels in our service and sales vehicle fleet.
As a result of the opening and closing of facilities and changes to the fleet inventory, base-line adjustments are made each year, which are reflected in the Energy Consumption and GHG Emission charts. In 2016, we expanded our GHG tracking of indirect, or Scope 3, emissions to include end-of-life treatment of sold products. We also continue to track Scope 3 emissions from employee business travel, product transport, employee commute and waste generated in operations.
In 2016, Xerox GHG emissions totaled 233,305 metric tons of CO2e, which is a 28 percent reduction from a 2012 baseline and surpasses our 2020 reduction target of 20 percent. About 56 percent of the GHG emissions total were indirect emissions from purchased electricity and steam. The remaining 44 percent were direct emissions from the combustion of natural gas, gasoline and diesel fuel. Xerox-owned or leased facilities, such as manufacturing sites, offices and warehouses, are associated with 54 percent of our direct GHG emissions. The remaining 46 percent are direct emissions from our service and sales vehicle fleet and other mobile sources.
Greenhouse Gas Emissions

Scope 3 Emissions
Scope 3 emissions result from activities commissioned by Xerox, but take place at a third party and/or arise from sources not owned or controlled by Xerox. Therefore, the collection of indirect, or Scope 3, GHG emissions is challenging. The probability of data inaccuracy with Scope 3 emissions is higher than for Scope 1 or 2 emissions for several reasons. These include the limited availability of data from the supply chain and, the more tiers of suppliers there are in the system, the more onerous the data collection process is. In order to overcome some of these challenges, we calculate Scope 3 emissions according to the Greenhouse Gas Protocol Corporate Value Chain (Scope 3) Accounting and Reporting Standard. This standard provides requirements and guidance to collect, prepare and publicly report a GHG inventory that includes indirect emissions. The Scope 3 emissions information is also used to prioritize our GHG emission reduction efforts and to integrate consideration of carbon impact into our sourcing and internal decision-making.
Third Party GHG Verification
Our 2016 Scope 1, Scope 2 and Scope 3 GHG emissions have been verified by a third party verification/assurance company in accordance with ISO 14064-3:2006 against our internally defined methodology described in “Xerox Corporation Greenhouse Gas Emissions Inventory Management Plan, Version 2, December 2016” and the principles of: transparency, accuracy, consistency, completeness and relevance.
Climate Change Risks and Opportunities
Xerox has examined the regulatory, physical and commercial risks and opportunities associated with climate change across our value chain.
We assess and manage our carbon risk by maintaining both a comprehensive GHG emissions inventory and a mature regulatory tracking function that provides the necessary information to stay abreast of developing regulation. We do not consider our company to be subject to unique risks due to changing weather patterns, rising temperatures and sea level rise, but we recognize that our business and our customers could be affected by more frequent disruptions as a result of severe weather in locations where we operate. We may need to invoke our business continuity and resumption plans to aid customers and employees who are impacted by business disruptions on account of severe weather. We have experience working to ensure continuity of critical applications by prioritizing business needs and developing customer-specific preparedness plans where appropriate. These plans include communication with employees and customers, management of employee health and safety issues, business continuity and resumption processes, as well as interaction with government organizations.
We recognize that the increasing costs of energy and concerns around energy security are issues that affect both our operations and our customers. To meet our commitment for “Reducing Energy Use and Protecting the Climate,” our long-term strategy is to continue to invest in technologies that reduce the carbon footprint of our operations and develop technology solutions that help our customers to reduce the energy and environmental impacts of their business.
Preserving Clean Air and Water
Air Emissions
Xerox has significantly reduced manufacturing air emissions over the past 20 years, but we continue to pursue efforts to do even more.
Most of our air emissions originate from the production of imaging supplies such as toner, photoreceptor drums and belts as well as fuser rolls. Approximately 25 metric tons of volatile organic compound (VOC) process air emissions (VOC and non-VOC) were released to the atmosphere from these activities in 2016. Emission reductions over time primarily have come from process modification, lower production volumes of legacy products and production declines attributable to longer-life components.
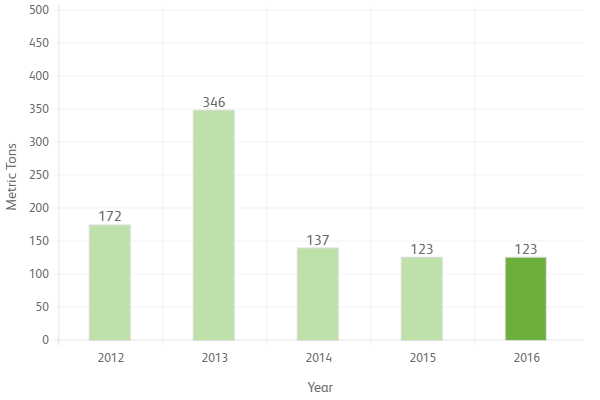
Volatile Organic Process Air Emissions

Emissions for years 2013 through 2015 are based on actual usage records. Since usage records were not available for 2016, quantities were estimated based on a survey assuming worst case scenarios. Actual air emissions for 2016 may be lower than shown.
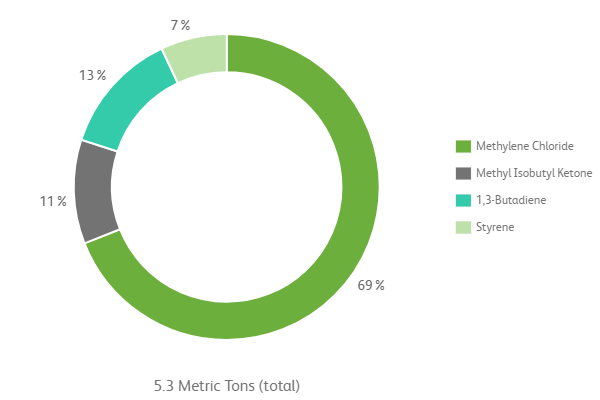
A subset of these VOC emissions is defined by the U.S. Environmental Protection Agency (EPA) as hazardous air pollutants (HAP). In 2016, Xerox reported worldwide air emissions of approximately 5.3 metric tons of HAP under national toxic chemical release regulations, including the U.S. Toxic Release Inventory (TRI) program. Methylene chloride, methyl isobutyl ketone (MIBK), 1,3-butadiene and styrene represent virtually all of these HAP emissions.
2016 HAP Air Emissions
as Reported under National Toxic Release Regulations
Ozone-Depleting Substances
Xerox policy prohibits the use of ozone-depleting substances (ODS) as ingredients in the manufacturing processes for products and finished products including spare parts, accessories, consumables and packaging. ODS used as refrigerants in facility and vehicle air conditioning systems and various food/equipment-cooling systems are in compliance with applicable global regulations. Elimination of ODS as refrigerants is managed consistent with government phase-out dates.
Toxic Chemical Releases
The release of materials used in our worldwide operations is evaluated annually and reported to government agencies under national toxic chemical release reporting regulations, such as the U.S. TRI, the Canadian National Pollution Release Inventory and the European Pollutant Release and Transfer Register. Releases for reporting year 2016 remained unchanged compared to 2015 levels and were 75 percent lower than 2007 levels. Note: 2015 values are updated in this report to include approximately 5 metric tons of releases and transfers that were inadvertently excluded at that time.
Reportable Toxic Chemical Releases and Transfers
In 2011, operations with reportable toxic chemical releases to the air, land or water — in amounts of greater than one metric ton — established goals, targets and objectives related to chemical releases. Progress against these goals as of year-end 2016 is summarized below:
- An initiative to reclaim spent methyl isobutyl ketone (MIBK) continued to exceed expectations in the fifth full year of implementation. Recovered solvent was qualified for use as a cleaning solvent for the fluid delivery systems used in U.S. fuser roll coating operations. As a result, the amount of virgin MIBK purchased in 2016 for use in the manufacturing operation has been reduced by 43 percent from the 2010 baseline on a normalized, per-part basis.
- Methylene chloride used in the manufacture of Xerox photoreceptor belts was reduced by 70 percent from the 2010 baseline, greatly exceeding target. This dramatic decrease was primarily due to volume declines of legacy products and process modifications that cut the amount of methylene chloride used for batch cleaning of production equipment.
- Per-batch emissions of 1,3-butadiene from U.S. toner resin manufacturing operations decreased slightly, exceeding target in 2016. Low-emission hose connectors and incident-free material handling operations contributed to this result.
Spills and Accidental Releases
Our goal is to proactively prevent any release of regulated materials to air, soil and water. In 2016, ten reportable spills or releases occurred at Xerox operations. Most of these spills/releases were minor in nature, contained and had little to no impact on the environment, while only two releases were relatively significant. The first significant release occurred at our Webster, New York facility, where 0.45 metric tons of methylene chloride was released to the air over the course of several hours as a result of equipment failure. The second significant release occurred in Ontario, Canada, where 32,000 liters of wastewater was prematurely discharged to the sanitary sewer from toner manufacturing operations due to a programming error. While the reporting of these spills is not a GRI requirement, they are included in this report for the purpose of transparency. Xerox received no fines or non-monetary sanctions for any spills in 2016 and corrective measures were implemented to minimize the potential for these incidents to occur in the future.
Water Consumption and Treatment
As part of our commitment to conserve resources, we monitor water consumption across our manufacturing, distribution and R&D facilities worldwide. Water consumed by Xerox operations is sourced from local municipal suppliers that withdraw water from the ground, lakes, rivers or other surface waters.
In 2016, we exceeded our goal to reduce water consumption by 35 percent (against a 2010 baseline), years ahead of our targeted date of 2020. Our annual water consumption was down 43 percent due to a combination of conservation initiatives and production declines.
A pilot program was initiated at our plant in Wilsonville, Oregon, to evaluate the use of Reverse Osmosis reject water for secondary use. This project was implemented in mid-2016. During the year, more than 265,000 gallons (1.003 million liters) of reject water – which would have otherwise have been sewered - were reused onsite in cooling towers.
The water discharges at manufacturing sites are monitored to validate compliance with local sanitary sewer discharge limits. Wastewater from manufacturing processes is treated, as necessary, before being discharged into local sanitary sewers. We utilize best practices to prevent unwanted pollutants from entering waterways via surface contamination and run-off. Extensive sampling of wastewater, discharged to both sanitary and storm sewers, ensures that discharged water meets our strict requirements. Although Xerox has not established a goal for reduction of wastewater discharges, it is worth noting that water discharged from our facilities in 2016 was approximately 32 percent lower (731 million liters) than in 2010. These results also can be attributed to water conservation initiatives and production declines.
Water Consumption

Revenue is from continuing operations attributable to Xerox Technology, revised for all periods to reflect discontinued operations.
Preventing and Managing Waste
Hazardous Waste
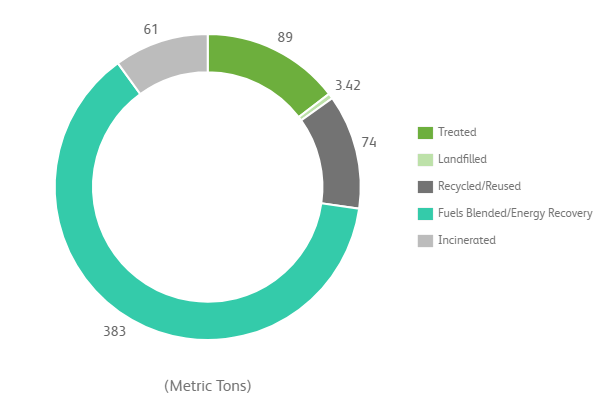
In 2016, the amount of hazardous waste generated was 11 percent higher than in 2015 as a direct result of decommissioning activities at a European manufacturing site, production increases and a raw material contamination incident. Xerox beneficially managed 75 percent of the hazardous waste generated in 2016 through recycling and/or fuels blending technologies.
Xerox does not export hazardous waste to developing nations. A third-party supplier recovers spent MIBK, which is returned to the generating manufacturing operation for reuse. Solid and liquid hazardous waste streams that have an adequate BTU value are managed via a fuels blending program. An off-site waste disposal vendor blends these waste streams to meet the specifications provided by cement kilns.
Hazardous Waste Generated
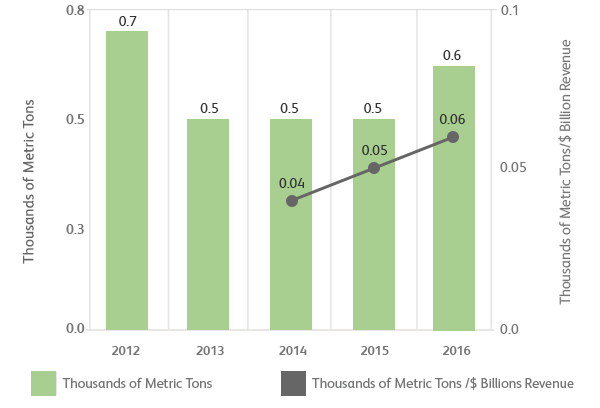
Revenue is from continuing operations attributable to Xerox Technology, revised for all periods to reflect discontinued operations.
2016 Hazardous Waste Management Methods
Non-hazardous Solid Waste
Xerox has had waste reduction efforts in place for many years. We reuse boxes, pallets and containers for parts delivery. We capture toner that is outside the acceptable size range during manufacturing, recycle returned equipment and reuse totes for recycling scrap metal and paper.
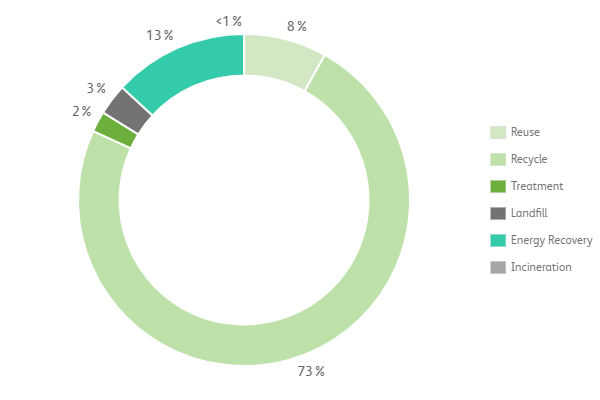
Globally, operations generated 39,000 metric tons of non-hazardous solid waste in 2016, down from 47,100 metric tons in 2015. Process waste consists primarily of paper, wood, pallets, waste toner, plastics and packaging waste such as corrugated cardboard. Equipment manufacturing waste includes scrap metal, waste batteries and lamps, miscellaneous trash, and non-usable end-of-life equipment and parts that our customers return to Xerox for processing and remanufacturing. This waste made up about 73 percent of the non-hazardous solid waste managed by Xerox operations in 2016. Xerox is able to reuse or recycle nearly 100 percent of the waste generated from our customer returns.
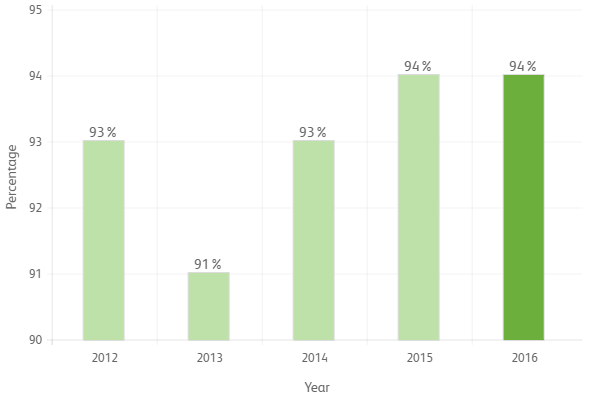
Our goal is to attain a reuse/recycle rate of 100 percent by 2020 at facilities globally, compared to a baseline year of 2009. In 2015 and 2016, we managed 94 percent of non-hazardous solid waste beneficially, up from 93 percent in 2014. The increased reuse/recycle rate is attributed to an increase in our manufacturing operations using energy-from-waste technology as a means of dispositioning waste that is not recyclable. Additionally, in 2016 our equipment resellers were able to return a greater number of products to the marketplace for resale. That resulted in a significant reduction of all non-hazardous waste. Please note that the reuse/recycle rate has been revised from previous years to more accurately represent non-hazardous waste management methods.
Non-hazardous Waste
Annual volume by Management Method

Revenue from continuing operations attributable to Xerox, revised for all periods to reflect discontinued operations.
2016 Non-Hazardous Waste Management Methods
Percentage by Management Method
Non-hazardous Solid Waste Recycling Rate
Environmental Remediation and Compliance
In 1985, we voluntarily assessed our real estate portfolio globally and identified 68 facilities with environmental contamination. We worked closely with the appropriate federal, state and local agencies to initiate prompt and appropriate measures to ensure the protection of employees, neighbors and the environment.
Today, only two of the original 68 sites require active remedial or control measures. We have effectively removed or greatly reduced the source areas of contamination and have remediated these properties for reuse or redevelopment. We are now completing post-remediation compliance monitoring at sites that are no longer subject to active remediation, which will enable the regulatory process for managing these sites to be terminated officially.
In addition to using conventional techniques for groundwater recovery and treatment and soil excavation, we have a history of developing innovative technologies to enhance our remedial efforts. These included techniques that improve and accelerate the recovery of contaminants such as high-vacuum 2-Phase Extraction and enhanced bedrock fracturing. We also employ technologies where contaminants are converted to less-harmful substances through enhanced natural biodegradation and chemical oxidation.
Compliance Reporting
We require our operations and subsidiaries worldwide to report allegations of regulatory non compliances to our Environmental Health, Safety and Sustainable (EHS&S) group for evaluation and corrective action, where appropriate. In 2016, two instances resulted in a notice of violation. One notice was due to water discharges exceeding wastewater discharge limits. The second notice involved the lack of registration on a petroleum bulk storage tank. No fines or non-monetary sanctions were issued for either notice of violation. Corrective actions have been completed and appropriate controls implemented to ensure ongoing compliance.